BALTIMORE (Stockpickr) -- The Fed is shutting the tap this week, ending the QE3 bond-.buying program that's arguably been one of the biggest structural drivers of the rally in stocks over the past couple of years. Or at least that's the plan.
Must Read: Warren Buffett's Top 10 Dividend Stocks
While the Fed's press release calls for an end to quantitative easing, this isn't the first time they've called an end to the buying spree before starting another one. With key data, such as forward inflation lower than it's been since Operation Twist in 2011, the possibility of QE4 (or QE5, depending on how you've been counting) is becoming more palpable by the day.
So far, stocks have had a pretty tepid reaction to the end of QE3. The decision was largely already baked into stock prices. As I write, there are some big-name trades that are starting to look very attractive as a result. Today, we're taking a technical look at five large-cap stocks worth trading this week.
First, a little on the technical toolbox we're using here. Technicals are a study of the market itself. Since the market is ultimately the only mechanism that determines a stock's price, technical analysis is a valuable tool even in the roughest of trading conditions. Technical charts are used every day by proprietary trading floors, Wall Street's biggest financial firms, and individual investors to get an edge on the market. And research shows that skilled technical traders can bank gains as much as 90% of the time.
Every week, I take an in-depth look at big names that are telling important technical stories. Here's this week's look at five big stocks to trade this week.
Must Read: How to Trade the Market's Most-Active Stocks
Capital One Financial
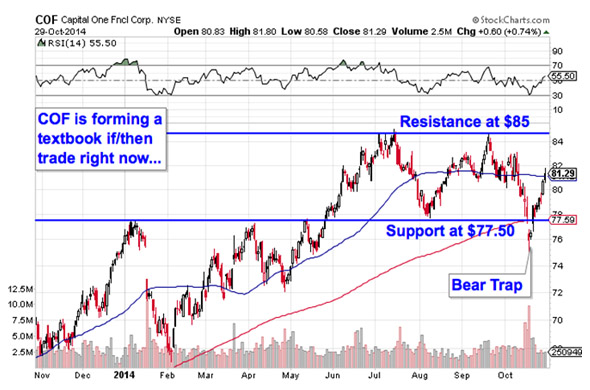
Up first is big banking company Capital One Financial (COF). Capital One has been in rally mode for much of the year, climbing more than 18% since the beginning of February. And while shares have been churning sideways for the last few months, that range-bound price action is the exact reason that COF looks tradable here.
COF has been consolidating sideways for the last few months, bouncing around in a rectangle pattern. The rectangle setup is formed by a pair of horizontal resistance and support levels that basically "box in" shares between $85 and $77.50. Consolidations such as the one in Capital One are common after big moves (like the one that started in February); they give the stock a chance to bleed off momentum as buyers and sellers figure out their next move.
Don't get thrown by the bear trap in COF. It was a false breakdown. The bullish divergence with momentum was a tip-off that the drop wouldn't hold.
From here, a breakout above $85 is the next buy signal on the way up -- a violation of support at $77.50 means more downside suddenly looks likely. Because Capital One's prior trend before it entered the rectangle was higher, a move through $85 looks like the more likely outcome for this stock.
Must Read: 5 Stocks Insiders Love Right Now
Bank of Ireland
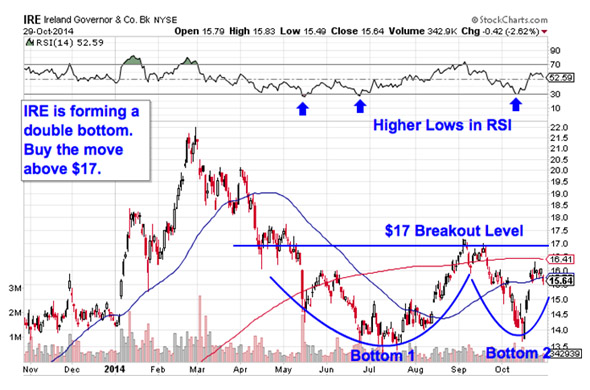
Bank of Ireland (IRE) may be a lot smaller than Capital One, but its positioning as one of the biggest banks in Ireland gives this $13 billion firm considerable significance -- and trading volume. Bank of Ireland has been selling off for most of 2014, but buyers could be in for a reprieve this fall. That's because IRE is currently forming a long-term reversal pattern called a "double bottom."
The double bottom in IRE looks just like it sounds. The setup is formed by a pair of swing lows that bottom out at approximately the same price level. The buy signal comes on a push above $17, the price peak that separates those two lows in IRE. Shares are pointed lower this morning in reaction to the dollar rally that got kicked off by the Fed's QE3 announcement, but that move isn't technically significant as long as IRE stays above $13.50.
Meanwhile, the side indicator in the IRE trade is momentum, measured by 14-day RSI. Momentum has been making higher lows, even as shares hit the same lows in price – that's a bullish indication that buying pressure is building in this stock. Even so, don't be a buyer until $17 gets taken out; that's still a meaningful price barrier at this time.
Must Read: 10 Stocks George Soros Is Buying
Discover Financial Services
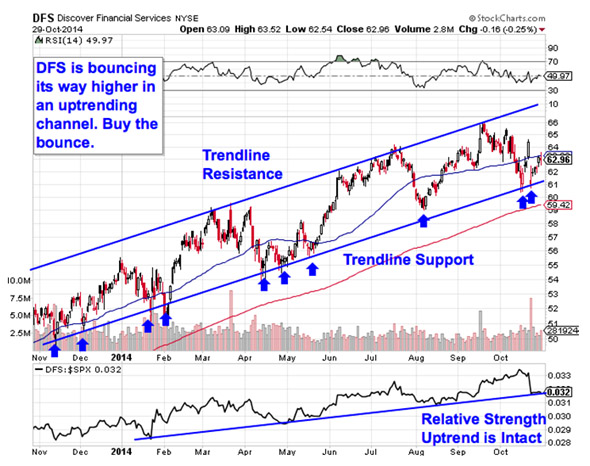
The financial sector is getting a lot of attention on today's list, and our next trade setup is no exception; we're looking at Discover Financial Services' (DFS) chart next. The good news is that you don't need to be an expert technical trader to figure out what's going on in shares of DFS. This setup is about as basic as it gets.
Discover has been bouncing its way higher in a well-defined uptrending channel for the better part of the last year now. That channel is formed by a pair of parallel trend line support and resistance levels that identify the high-probability range for shares to stay within. Put more simply, every touch of trend line support in 2014 has been an extremely low-risk opportunity to get into shares of DFS, and we're touching that level for a tenth time this week. It makes sense to buy this bounce off of support.
Waiting for a bounce off of support is a critical test for two big reasons: It's the spot where shares have the furthest to move up before they hit resistance, and it's the spot where the risk is the least (because shares have the least room to move lower before you know you're wrong). Remember, all trend lines do eventually break, but by actually waiting for the bounce to happen first, you're ensuring DFS can actually still catch a bid along that line before you put your money on shares.
Relative strength adds some confidence to that call. The relative strength line at the bottom of Discover's chart has been in a textbook uptrend since the end of last year. As long as that uptrend remains intact, DFS should keep outperforming the rest of the market.
Must Read: 5 Rocket Stocks to Buy for November Gains
Charter Communications
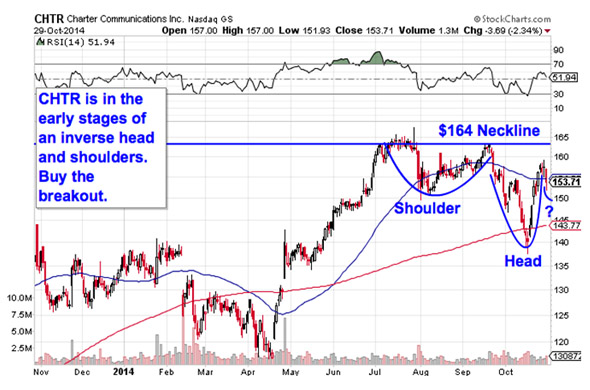
Charter Communications (CHTR) has been a name to own in 2014: since the calendar flipped over to January, shares of this $17 billion cable company have rallied more than 12%. That's nearly double what the S&P 500 has managed to accomplish over that same stretch. But don't worry if you missed the move. CHTR looks ready to kick off another leg higher this fall. Here's how to trade it.
CHTR is in the early stages of forming an inverse head and shoulders setup, a bullish reversal pattern that indicates exhaustion among sellers. You can spot the inverse head and shoulders by looking for two swing lows that bottom out around the same level (the shoulders), separated by a bigger trough called the head; the buy signal comes on the breakout above the pattern's "neckline" level (that's the $164 price level here).
Even though the right shoulder hasn't formed yet, any close above $164 from here is a buy signal in Charter.
Must Read: 5 Hated Earnings Stocks You Should Love
Philip Morris International
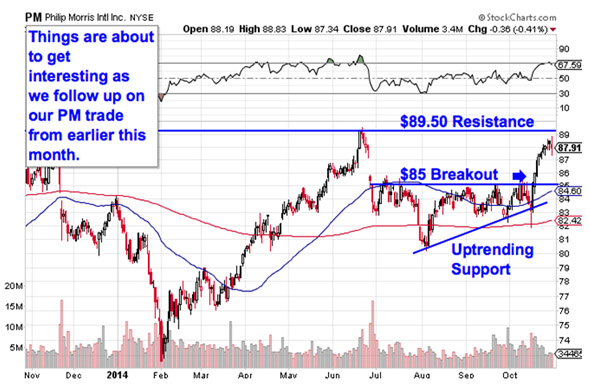
Last up is Philip Morris International (PM), a name that we first looked at a couple of weeks ago. At the time, PM was forming a bullish ascending triangle pattern, and the buy signal came on a breakout through $85. Since then, shares have moved up near our $89.50 price target – and PM is starting to look ready for a secondary breakout.
If shares can catch a bid above their previous high at $89.50, then we've got another big buy signal in this tobacco giant.
Why all of that significance at that $89.59 level? It all comes down to buyers and sellers. Price patterns like the ascending triangle are a good quick way to identify what's going on in the price action, but they're not the actual reason a stock is tradable. Instead, the "why" comes down to basic supply and demand for PM's stock.
The $89.50 resistance level is a price where there has been an excess of supply of shares; in other words, it's a spot where sellers have previously been more eager to step in and take gains than buyers have been to buy. That's what makes a breakout above $89.50 so significant. The move means that buyers are finally strong enough to absorb all of the excess supply above that price level.
Expect some downside today thanks to the dollar rally (PM is sensitive to upside in the dollar because it earns revenues in foreign currencies but reports in dollars), but $89.50 is the line in the sand to watch next. If you bought the $85 breakout, I'd recommend ratcheting your stop loss up to the 50-day moving average.
To see this week's trades in action, check out the Must-See Charts portfolio on Stockpickr.
-- Written by Jonas Elmerraji in Baltimore.
Must Read: 10 Stocks Billionaire John Paulson Loves in 2014
Follow Stockpickr on Twitter and become a fan on Facebook.
At the time of publication, author had no positions in the names mentioned.
Jonas Elmerraji, CMT, is a senior market analyst at Agora Financial in Baltimore and a contributor to
TheStreet. Before that, he managed a portfolio of stocks for an investment advisory returned 15% in 2008. He has been featured in Forbes , Investor's Business Daily, and on CNBC.com. Jonas holds a degree in financial economics from UMBC and the Chartered Market Technician designation.Follow Jonas on Twitter @JonasElmerraji
No comments:
Post a Comment