Troublemakers in Egypt and Syria – and some saber-rattling American politicians – helped send oil to a new high this week. The price of oil has broken out to the upside of the "double top" pattern I showed you a few weeks ago. So instead of a quick profit off an oil breakdown, anyone who shorted shares of the United States Oil Fund (USO) should have stopped out of the trade for a tiny loss. Now with a new set of circumstances – and a new chart pattern – it's time to take another look at oil and see what the next trade setup might look like... Here's a chart of West Texas Intermediate (WTI) crude, the benchmark U.S. oil price...
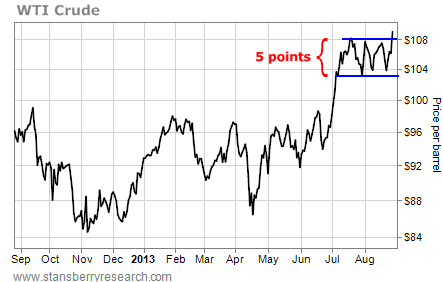
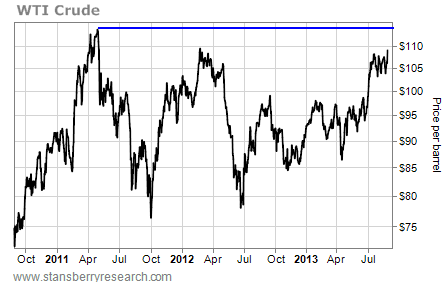
As you can see in the chart above, the difference between oil's recent support and resistance levels is about five points. So if we add five points to the breakout level of $108, we get a target price for oil of $113. That target price lines up well with the resistance of oil's former high price in 2011. Take a look at this longer-term chart...
But there are still several reasons to be bearish on oil. Oil inventories are higher than average for this time of year and it has a seasonal tendency to decline in September. Also, demand for oil has been declining due to sluggish economic growth. The big reason to be bullish right now is the impending U.S. military action in Syria. That possibility trumps the supply/demand concerns. It has pushed oil to its highest price in two years. And it'll likely push prices a bit higher. But as the price of oil approaches the $113 target level and the threat of military action runs its course, oil is likely to form an important intermediate-term top. That will be the time for traders to take another shot at a short sale in the oil market. Best regards and good trading, Jeff Clark
No comments:
Post a Comment